Fișier:StationaryStatesAnimation.gif

Conținutul paginii nu este suportat în alte limbi.
De la Wikipedia, enciclopedia liberă

StationaryStatesAnimation.gif(300 × 280 pixeli, mărime fișier: 223 KB, tip MIME: image/gif, în buclă, 41 imagini)

Acest fișier se află la Wikimedia Commons. Consultați pagina sa descriptivă acolo.

Descriere fișier

Descriere
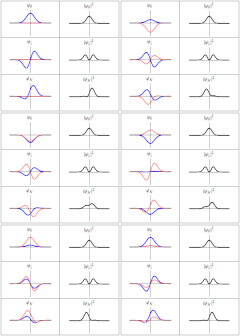
English: Three wavefunction solutions to the Time-Dependent Schrödinger equation for a harmonic oscillator. Left: The real part (blue) and imaginary part (red) of the wavefunction. Right: The probability of finding the particle at a certain position. The top two rows are the lowest two energy eigenstates, and the bottom is the superposition state , which is not an energy eigenstate. The right column illustrates why energy eigenstates are also called "stationary states".
Thus in every quantum stae,there are certain preferred positions of maximum probability
Dată
Sursă Operă proprie
Autor Sbyrnes321
(* Source code written in Mathematica 6.0 by Steve Byrnes, Feb. 2011. This source code is public domain. *)
(* Shows classical and quantum trajectory animations for a harmonic potential. Assume m=w=hbar=1. *)
ClearAll["Global`*"]
(*** Wavefunctions of the energy eigenstates ***)
psi[n_, x_] := (2^n*n!)^(-1/2)*Pi^(-1/4)*Exp[-x^2/2]*HermiteH[n, x];
energy[n_] := n + 1/2;
psit[n_, x_, t_] := psi[n, x] Exp[-I*energy[n]*t];
(*** A non-stationary state ***)
SeedRandom[1];
psinonstationary[x_, t_] := (psit[0, x, t]+psit[1, x, t])/Sqrt[2];

(*** Put all the plots together ***)
SetOptions[Plot, {PlotRange -> {-1, 1}, Ticks -> None, PlotStyle -> {Directive[Thick, Blue], Directive[Thick, Pink]}}];
MakeFrame[t_] := GraphicsGrid[
   {{Plot[{Re[psit[0, x, t]], Im[psit[0, x, t]]}, {x, -5, 5}, PlotLabel -> Subscript[\[Psi],0]], 
     Plot[Abs[psit[0, x, t]]^2, {x, -5, 5}, PlotStyle -> Directive[Thick, Black],
		PlotLabel -> TraditionalForm[Abs[Subscript[\[Psi],0]]^2]]},
   {Plot[{Re[psit[1, x, t]], Im[psit[1, x, t]]}, {x, -5, 5}, PlotLabel -> Subscript[\[Psi],1]], 
     Plot[Abs[psit[1, x, t]]^2, {x, -5, 5}, PlotStyle -> Directive[Thick, Black],
		PlotLabel -> TraditionalForm[Abs[Subscript[\[Psi],1]]^2]]},
   {Plot[{Re[psinonstationary[x, t]], Im[psinonstationary[x, t]]}, {x, -5, 5}, PlotLabel -> Subscript[\[Psi],N]], 
     Plot[Abs[psinonstationary[x, t]]^2, {x, -5, 5}, PlotStyle -> Directive[Thick, Black],
		PlotLabel -> TraditionalForm[Abs[Subscript[\[Psi],N]]^2]]}
   }, Frame -> All, ImageSize -> 300];
output = Table[MakeFrame[t], {t, 0, 4 Pi*40/41, 4 Pi/41}];
SetDirectory["C:\\Users\\Steve\\Desktop"]
Export["test.gif", output]

Licențiere

Eu, deținătorul drepturilor de autor ale acestei opere, prin prezenta îmi public lucrarea sub următoarea licență:
Creative Commons CC-Zero Acest fișier a fost eliberat sub licența Creative Commons CC0 1.0 Universal Public Domain Dedication.
Persoana care a asociat o operă cu acest document o oferă domeniului public, renunțând la toate drepturile asupra operei, în toată lumea, atât în ce privește drepturile de autor cât și orice alte drepturi juridice conexe pe care le avea asupra operei, în măsura permisă de lege. Puteți copia, modifica sau distribui opera, inclusiv în scopuri comerciale, fără a fi necesară permisiunea autorului.

Captions

Add a one-line explanation of what this file represents

Items portrayed in this file

subiectul reprezentat

20 martie 2011

Istoricul fișierului

Apăsați pe Data și ora pentru a vedea versiunea trimisă atunci.

Data și oraMiniaturăDimensiuniUtilizatorComentariu
actuală20 martie 2011 21:21Miniatură pentru versiunea din 20 martie 2011 21:21300x280 (223 KB)Sbyrnes321{{Information |Description ={{en|1=Three wavefunction solutions to the Time-Dependent Schrödinger equation for a harmonic oscillator. Left: The real part (blue) and imaginary part (red) of the wavefunction. Right: The probability of finding the partic

Următoarele pagini conțin această imagine:

Utilizarea globală a fișierului

Următoarele alte proiecte wiki folosesc acest fișier: