Fișier:65 Myr Climate Change.png

Conținutul paginii nu este suportat în alte limbi.
De la Wikipedia, enciclopedia liberă

65_Myr_Climate_Change.png(650 × 397 pixeli, mărime fișier: 21 KB, tip MIME: image/png)

Acest fișier se află la Wikimedia Commons. Consultați pagina sa descriptivă acolo.

Descriere fișier

Descriere
English:
Expanded view of climate change during the last five million years, showing the rapid oscillations in the glacial state.
View of climate change extending back through the last 540 million years, including many cycles of change from warm to cold and back again.

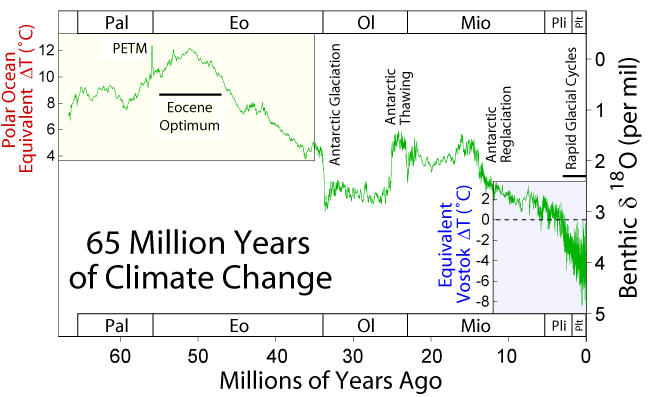
This figure shows climate change over the last 65 million years. The data are based on a compilation of oxygen isotope measurements (δ18O) on benthic foraminifera by Zachos et al. (2001) which reflect a combination of local temperature changes in their environment and changes in the isotopic composition of sea water associated with the growth and retreat of continental ice sheets.

Because it is related to both factors, it is not possible to uniquely tie these measurements to temperature without additional constraints. For the most recent data, an approximate relationship to temperature can be made by observing that the oxygen isotope measurements of Lisiecki and Raymo (2005) are tightly correlated to temperature changes at Vostok as established by Petit et al. (1999). Present day is indicated as 0. For the oldest part of the record, when temperatures were much warmer than today, it is possible to estimate temperature changes in the polar oceans (where these measurements were made) based on the observation that no significant ice sheets existed and hence all fluctuation in (δ18O) must result from local temperature changes (as reported by Zachos et al.).

The intermediate portion of the record is dominated by large fluctuations in the mass of the Antarctic ice sheet, which first nucleates approximately 34 million years ago, then partially dissipates around 25 million years ago, before re-expanding towards its present state 13 million years ago. These fluctuations make it impossible to constrain temperature changes without additional controls.

Significant growth of ice sheets did not begin in Greenland and North America until approximately 3 million years ago, following the formation of the Isthmus of Panama by continental drift. This ushered in an era of rapidly cycling glacials and interglacials (see figure at upper right).

Also appearing on this graph are the Eocene Climatic Optimum, an extended period of very warm temperatures, and the Paleocene-Eocene Thermal Maximum (labeled PETM). The PETM is very short lived high temperature excursion possibly associated with the destablization of methane clathrates and the rapid buildup of greenhouse gases in the atmosphere. Due to the coarse sampling and averaging involved in this record, it is likely that the full magnitude of the PETM is underestimated by a factor of 2-4 times its apparent height.
Dată 17 December 2005
Sursă Operă proprie
Autor Robert A. Rohde
Permisiune
(Reutilizarea acestui fișier)
This figure was prepared by Robert A. Rohde from published and publicly available data and is incorporated into the Global Warming Art project.

Licențiere

Image from Global Warming Art
This image is an original work created for Global Warming Art. Please refer to the image description page for more information.
GNU head Se permite copierea, distribuirea și/sau modificarea acestui document conform termenilor Documentației de licență liberă GNU, versiunea 1.2 sau orice altă versiune ulterioară publicată de Free Software Foundation, fără părți neschimbabile, texte de pe copertele principale și finale. O copie a acestei licențe este inclusă în secțiunea numită Documentația de licență liberă GNU.
w:ro:Creative Commons
atribuind partajând în condiții identice
Acest fișier a fost eliberat sub licența Creative Commons Atribuire și distribuire în condiții identice 3.0 Neadaptată.
Sunteți liber:
  • să partajați cu alții – aveți dreptul de a copia, distribui și transmite opera
  • să adaptați – aveți dreptul de a adapta opera
În următoarele condiții:
  • atribuind – Trebuie să atribuiți opera corespunzător, introducând o legătură către licență și indicând dacă ați făcut schimbări. Puteți face asta prin orice metodă rezonabilă, dar nu într-un fel care ar sugera faptul că persoana ce a licențiat conținutul v-ar susține sau ar aproba folosirea de către dumneavoastră a operei sale.
  • partajând în condiții identice – Dacă modificați, transformați sau creați pe baza acestei opere, trebuie să distribuiți opera rezultată doar sub aceeași licență sau sub o licență similară acesteia.
Această licență a fost atașată fișierului ca parte a actualizării licențierilor GFDL.


Notes

  • The data is plotted as a 10 point average of the original data to minimize measurement noise.
  • The absolute calibration of the early part of the record relative to modern-day is somewhat uncertain, so that the entire scale may need to be shifted ± a few degrees for a true comparison to present.
  • The labels on the top and bottom of the figure are abbreviations for different geologic epochs of the geologic time scale.
  • The data shown is very useful, when observing a long period of time.

References

  • Lisiecki, L. E., and M. E. Raymo (2005). "A Pliocene-Pleistocene stack of 57 globally distributed benthic δ18O records" (PDF). Paleoceanography 20: 1003. doi:10.1029/2004PA001071.[dead link]
  • Petit J.R., Jouzel J., Raynaud D., Barkov N.I., Barnola J.M., Basile I., Bender M., Chappellaz J., Davis J., Delaygue G., Delmotte M., Kotlyakov V.M., Legrand M., Lipenkov V., Lorius C., Pépin L., Ritz C., Saltzman E., Stievenard M. (1999). "Climate and Atmospheric History of the Past 420,000 years from the Vostok Ice Core, Antarctica". Nature 399: 429–436.
  • Zachos, James, Mark Pagani, Lisa Sloan, Ellen Thomas, and Katharina Billups (2001). "Trends, Rhythms, and Aberrations in Global Climate 65 Ma to Present". Science 292 (5517): 686–693. doi:10.1126/science.1059412.

derivative works

Creații derivate din acest fișier:

Captions

Add a one-line explanation of what this file represents

Items portrayed in this file

subiectul reprezentat

17 decembrie 2005

image/png

checksum engleză

fde0e20cdda21a80377578d80f730e3bed593b68

397 pixel

650 pixel

Istoricul fișierului

Apăsați pe Data și ora pentru a vedea versiunea trimisă atunci.

Data și oraMiniaturăDimensiuniUtilizatorComentariu
actuală18 iulie 2010 16:15Miniatură pentru versiunea din 18 iulie 2010 16:15650x397 (21 KB)SeL mediatime axis reversed
18 decembrie 2005 01:51Miniatură pentru versiunea din 18 decembrie 2005 01:51650x397 (25 KB)Saperaud~commonswiki*'''Description:''' [[en:Image:{{subst:PAGENAME}}]]

Următoarele pagini conțin această imagine:

Utilizarea globală a fișierului

Următoarele alte proiecte wiki folosesc acest fișier:

Vizualizați utilizările globale ale acestui fișier.