
Fișier:South Africa 2011 dominant language map.svg

Mărimea acestei previzualizări PNG a acestui fișier SVG: 684 × 599 pixeli. Alte rezoluții: 274 × 240 pixeli | 548 × 480 pixeli | 876 × 768 pixeli | 1.168 × 1.024 pixeli | 2.337 × 2.048 pixeli | 809 × 709 pixeli.
Mărește rezoluția imaginii (Fișier SVG, cu dimensiunea nominală de 809 × 709 pixeli, mărime fișier: 798 KB)
| Acest fișier se află la Wikimedia Commons. Consultați pagina sa descriptivă acolo. |
Descriere fișier
| Descriere |
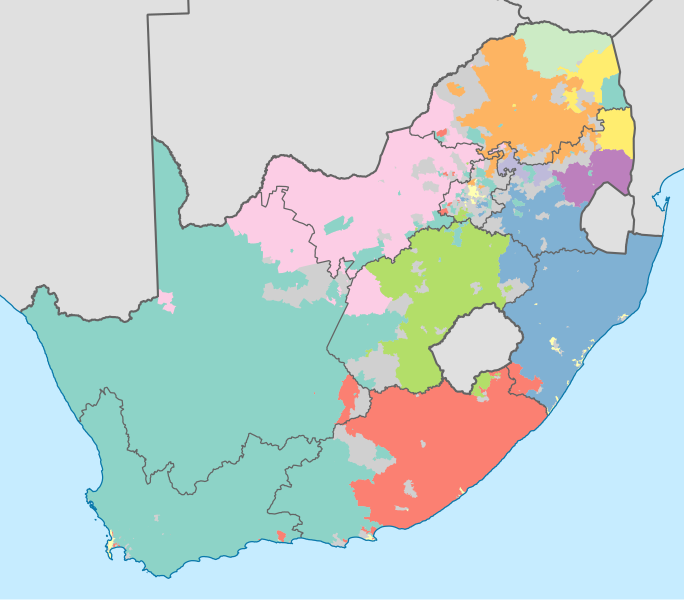
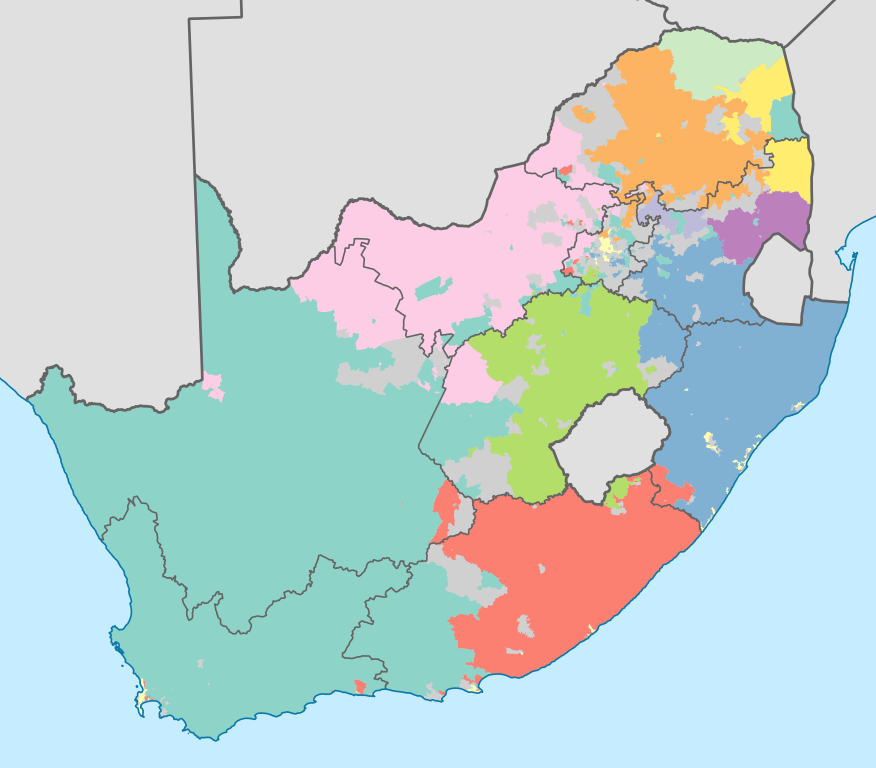
English: Map showing the dominant home languages in South Africa, based on ward-level data from the 2011 census. In this context, a language is dominant if it more than 50% of the population in a ward speak it at home, or more than 33% speak it and no other language is spoken by more than 25%.
English
Afrikaans
isiNdebele
isiXhosa
isiZulu
Sesotho sa Leboa
Sesotho
Setswana
siSwati
Tshivenda
Xitsonga
No language dominant
Projection is Albers Equal-Area Conic, with standard parallels at 25.5° S and 31.5° S, and origin at 28.5° S 24.5° E. |
| Dată | |
| Sursă | Statistics South Africa's Census 2011 is the source of the basic population data. The map results from my own processing of the data. For ward boundaries see File:South Africa electoral wards 2011 blank.svg. |
| Autor | Htonl |
| Alte versiuni |
South Africa 2011 dominant language map (hex cells).svg: .svg) |
Licențiere
The following license applies to the population data on which the map is based:

|
Deținătorul drepturilor de autor ale acestui fișier, Stats SA, permite oricui să-l folosească în orice scop, atâta timp cât opera îi este atribuită. Redistribuirea, lucrările derivate, utilizarea în scop comercial, precum și orice alt tip de utilizare sunt permise. |
Atribuire:
"the user acknowledges Stats SA as the source of the basic data wherever they process, apply, utilise, publish or distribute the data, and also that they specify that the relevant application and analysis (where applicable) result from their own processing of the data" [1]
|
The following tag applies to the map itself:
| Eu, deținătorul drepturilor de autor ale acestei opere, o eliberez domeniului public. Aceasta se aplică în întreaga lume. În anumite țări există posibilitatea ca acest lucru să nu fie legal posibil; în acest caz: permit oricui să utilizeze această operă în orice scop, fără nicio condiție, atâta timp cât asemenea condiții nu sunt cerute de lege. |
Istoricul fișierului
Apăsați pe Data și ora pentru a vedea versiunea trimisă atunci.
| Data și ora | Miniatură | Dimensiuni | Utilizator | Comentariu | |
|---|---|---|---|---|---|
| actuală | 19 noiembrie 2012 00:09 | | 809x709 (798 KB) | Htonl | =={{int:filedesc}}== {{Information |Description={{en|1=Map showing the dominant home languages in South Africa, based on ward-level data from the 2011 census. In this context, a language is dominant if it more than 50% of the population in a ward speak... |
Utilizarea fișierului
Următoarele pagini conțin această imagine:
Utilizarea globală a fișierului
Următoarele alte proiecte wiki folosesc acest fișier:
- Utilizare la af.wikipedia.org
- Utilizare la cs.wikipedia.org
- Utilizare la de.wikipedia.org
- Utilizare la dsb.wikipedia.org
- Utilizare la en.wikipedia.org
- Utilizare la eo.wikipedia.org
- Utilizare la frr.wikipedia.org
- Utilizare la fr.wikipedia.org
- Utilizare la fr.wiktionary.org
- Utilizare la he.wikipedia.org
- Utilizare la it.wikipedia.org
- Utilizare la ka.wikipedia.org
- Utilizare la ko.wikipedia.org
- Utilizare la lb.wikipedia.org
- Utilizare la ml.wikipedia.org
- Utilizare la mzn.wikipedia.org
- Utilizare la no.wikipedia.org
- Utilizare la pt.wikipedia.org
- Utilizare la rm.wikipedia.org
- Utilizare la ru.wikipedia.org
- Utilizare la sh.wikipedia.org
- Utilizare la simple.wikipedia.org
- Utilizare la sr.wikipedia.org
- Utilizare la ss.wikipedia.org
- Utilizare la sv.wikipedia.org
- Utilizare la sw.wikipedia.org
- Utilizare la szl.wikipedia.org
- Utilizare la te.wikipedia.org
- Utilizare la tg.wikipedia.org
- Utilizare la tr.wikipedia.org
- Utilizare la uk.wikipedia.org
- Utilizare la xh.wikipedia.org
- Utilizare la zh.wikipedia.org
- Utilizare la zu.wikipedia.org