
Fișier:Population of France.svg

Mărimea acestei previzualizări PNG a acestui fișier SVG: 750 × 450 pixeli. Alte rezoluții: 320 × 192 pixeli | 640 × 384 pixeli | 1.024 × 614 pixeli | 1.280 × 768 pixeli | 2.560 × 1.536 pixeli.
Mărește rezoluția imaginii (Fișier SVG, cu dimensiunea nominală de 750 × 450 pixeli, mărime fișier: 10 KB)
| Acest fișier se află la Wikimedia Commons. Consultați pagina sa descriptivă acolo. |
Descriere fișier
| Descriere |
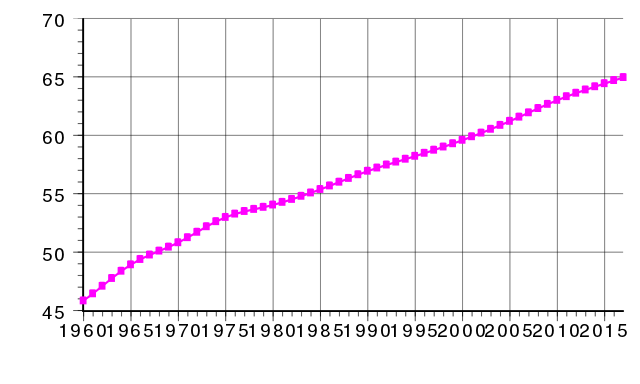
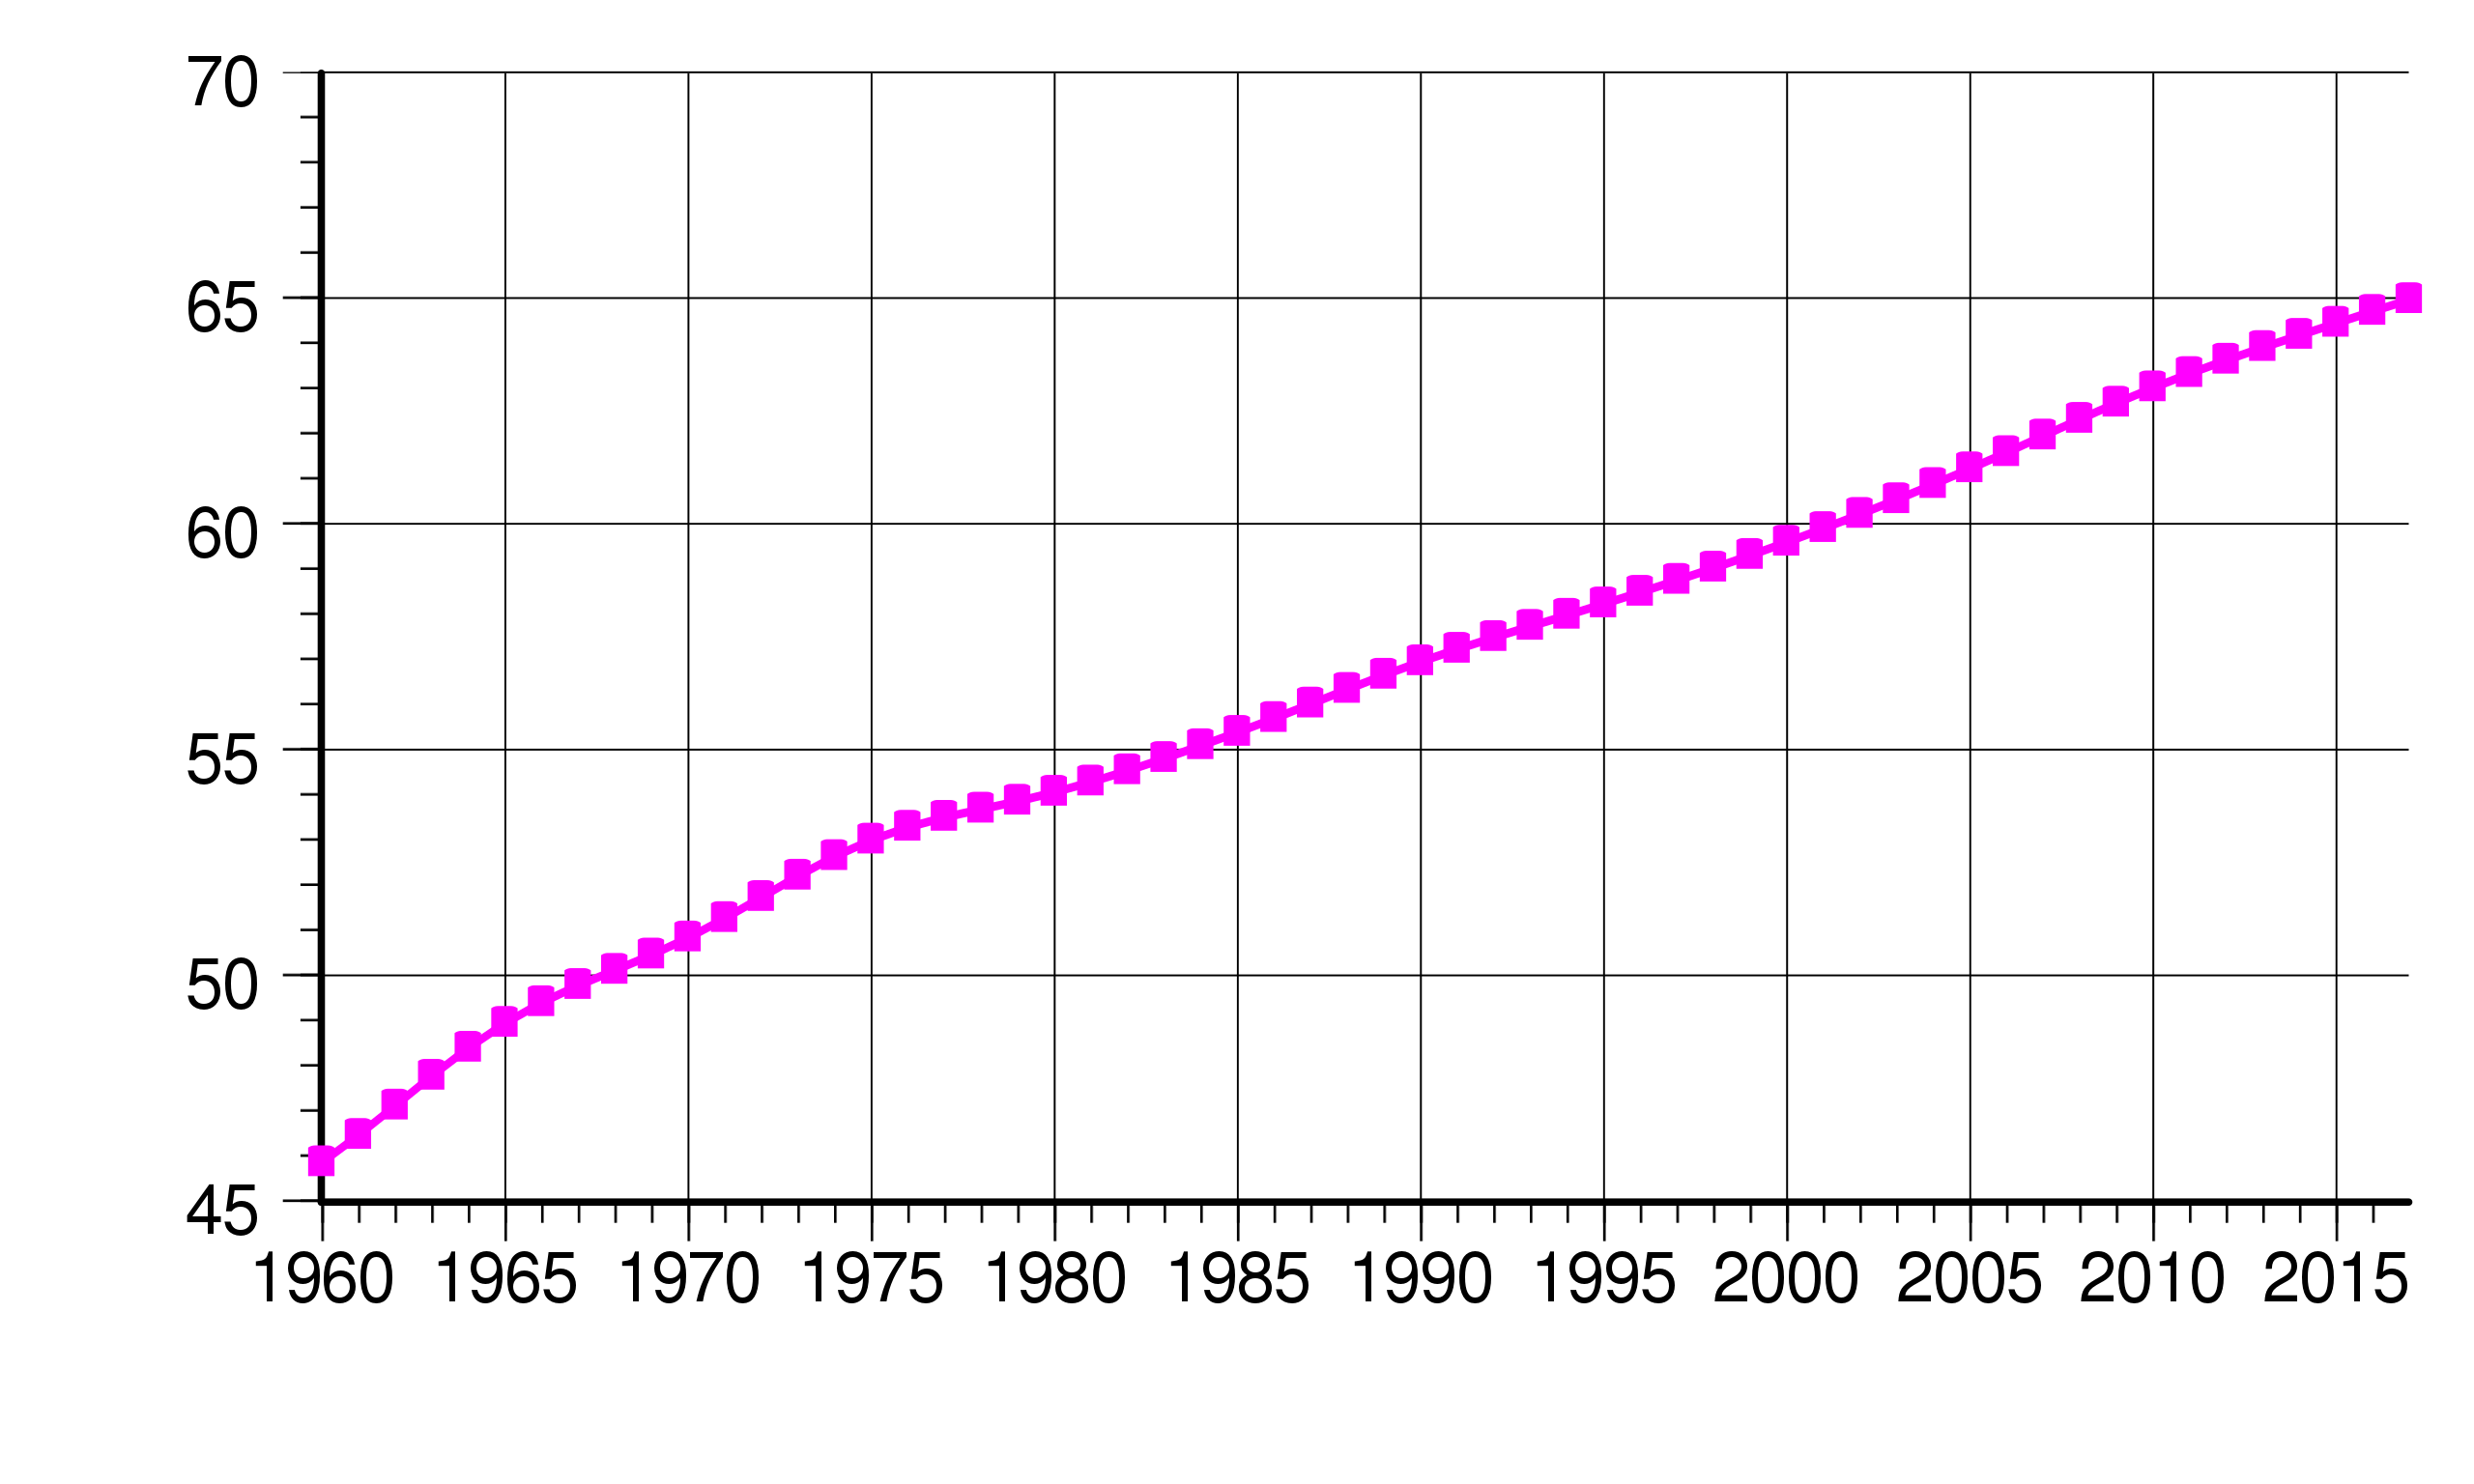
English: France's population (1960-2017). From UN estimates, World Population Prospects: The 2017 Revision Y-axis : Number of inhabitants in millions. |
| Dată | |
| Sursă | Operă proprie |
| Autor | Delphi234 |
Generated with Wikimedia SVG Chart
| Data format | The source data of the chart is in the SVG image file in a clearly readable format. You see the original numbers inside of the SVG file in the form of a list such as this:
... 1995 10.06 1996 11.75 1997 12.45 ... |
| Content of SVG | To view the data download the SVG file itself. To do so right-click this link, and then choose the option to save: File:Population of France.svg. Launch any text editor. Open the downloaded SVG file with the text editor (usually; file menu, open). To see the list of data, search for the phrase id="graph1". |
| Please, do not use a special SVG editor such as Inkscape; the readability of the database would be destroyed. You can edit the SVG file with any text editor, for example; en: List of text editors. You can view the edited SVG file in various web browsers. As of 2011, all major desktop browsers, and many minor ones, have some level of SVG support. See: en: Scalable Vector Graphics#Support for SVG in web browsers. When satisfied with your edits, upload the edited SVG file with the link labeled "Upload a new version of this file".
W3C-validity not checked. This chart was created with Wikimedia SVG Chart. This chart uses embedded text/digits. |
|
| Code to generate SVG | See: File talk:Population of France.svg. Documentation see: Wikimedia SVG Chart. |
Licențiere
Eu, deținătorul drepturilor de autor ale acestei opere, prin prezenta îmi public lucrarea sub următoarea licență:
| Acest fișier a fost eliberat sub licența Creative Commons CC0 1.0 Universal Public Domain Dedication. | |
| Persoana care a asociat o operă cu acest document o oferă domeniului public, renunțând la toate drepturile asupra operei, în toată lumea, atât în ce privește drepturile de autor cât și orice alte drepturi juridice conexe pe care le avea asupra operei, în măsura permisă de lege. Puteți copia, modifica sau distribui opera, inclusiv în scopuri comerciale, fără a fi necesară permisiunea autorului.
|
Istoricul fișierului
Apăsați pe Data și ora pentru a vedea versiunea trimisă atunci.
| Data și ora | Miniatură | Dimensiuni | Utilizator | Comentariu | |
|---|---|---|---|---|---|
| actuală | 29 octombrie 2017 19:58 | | 750x450 (10 KB) | Delphi234 | 2017 |
| 29 septembrie 2014 05:53 |  | 750x440 (9 KB) | Delphi234 | User created page with UploadWizard |
Utilizarea fișierului
Următoarele pagini conțin această imagine:
Utilizarea globală a fișierului
Următoarele alte proiecte wiki folosesc acest fișier:
- Utilizare la ast.wikipedia.org
- Utilizare la ch.wikipedia.org
- Utilizare la co.wikipedia.org
- Utilizare la el.wikipedia.org
- Utilizare la es.wikipedia.org
- Utilizare la fr.wikipedia.org
- Utilizare la gl.wikipedia.org
- Utilizare la id.wikipedia.org
- Utilizare la is.wikipedia.org
- Utilizare la it.wikipedia.org
- Utilizare la ka.wikipedia.org
- Utilizare la ms.wikipedia.org
- Utilizare la uz.wikipedia.org
- Utilizare la wuu.wikipedia.org